Not gut feeling.
Real data on developer behavior, delivery velocity, and AI tool impact.
Built for Engineering Managers, CTOs, VPs, and PMs
Sign Up 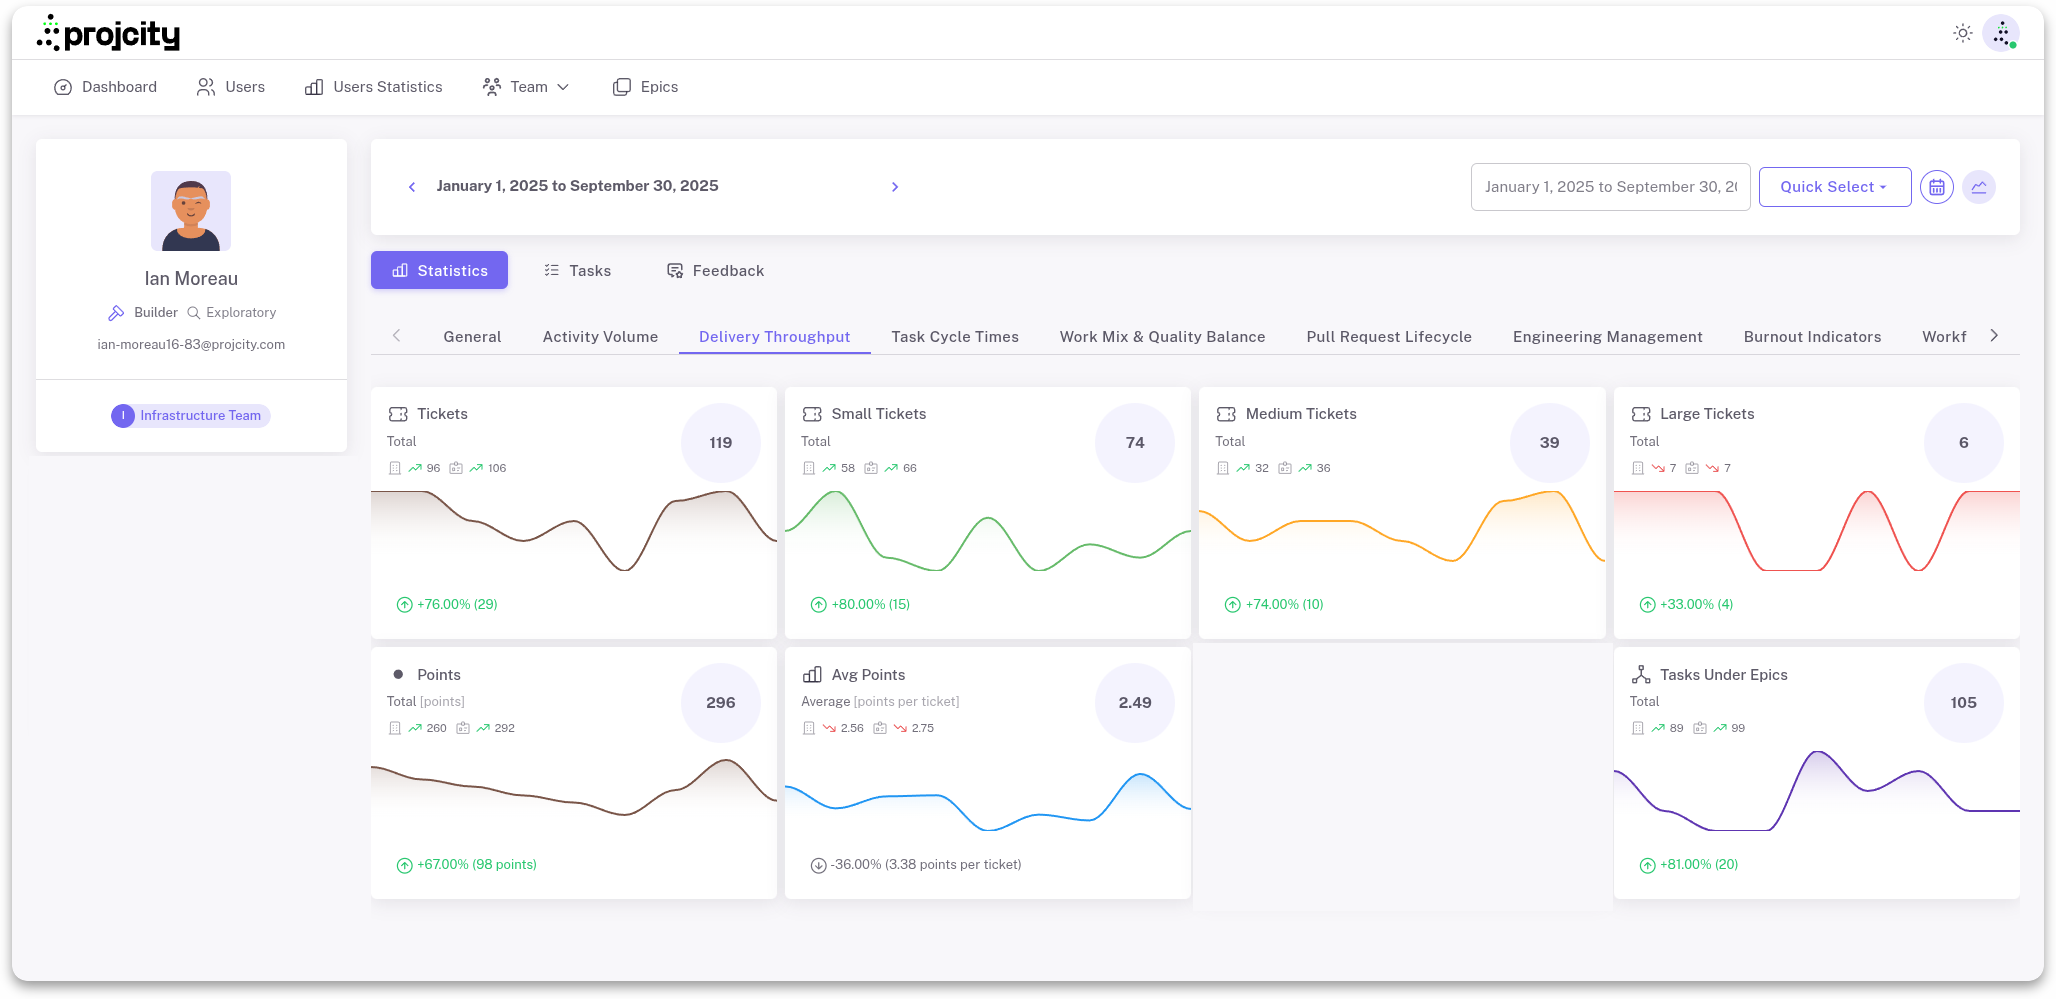
Built for Engineering Leaders
Whether you run 1-on-1s, own delivery, or set the technical direction, Projcity gives you the data to make better decisions.
Engineering Manager
- Walk into every 1-on-1 prepared — see who's thriving and who needs support
- Spot behavioral drift weeks before it becomes a difficult conversation
- Know which developer is overloaded before they tell you
CTO
- Connect team structure to delivery outcomes with real data
- See how AI coding tools are changing velocity, review depth, and code quality
- Make hiring and org design decisions backed by engineering data
VP of Engineering
- Forecast capacity and surface delivery risks before they hit your board deck
- Understand cross-team bottlenecks at a glance
- Present engineering health to leadership with real metrics, not instinct
Product Manager
- Know when engineering capacity estimates reflect reality
- See where your epics actually stand, not just what sprint commitments say
- Align roadmap timelines to actual delivery data
Teams using Claude Code, Copilot, and Cursor ship 2-3x more PRs. But reviews can't keep pace, PRs are massive, and most developers don't thoroughly check AI-generated code. Traditional metrics weren't designed for this new reality.
Review Bottlenecks Are Real
Your team ships way more PRs with AI, but reviews take significantly longer. Track time-to-review and coverage to catch the bottleneck before it chokes delivery.
PR Sizes Are Exploding
AI-generated PRs are 2-3x larger on average. Massive PRs slow reviews, hide bugs, and create comprehension debt. Track size to keep PRs reviewable.
Comprehension Debt Crisis
Developers review AI code they can't write independently. Most teams don't review AI code thoroughly. Track review depth to prevent rubber-stamping.
Quality Decay Detection
Many teams struggle with "almost right" AI solutions that look good but have hidden issues. Track bug ratio and rework rate to catch architectural mistakes early.
Stop guessing if AI is helping. Measure review bottlenecks, PR bloat, and quality decay.
See How to Measure the AI EraDevelopers Change How They Work.
We Track the Shift.
Other tools label developers once. Projcity detects behavioral drift in real-time based on actual work patterns.
Detect Behavioral Drift
A developer can be an Architect this month and a Bug Fixer the next. We track the shift.
Features built for engineering leaders who want clarity, not more dashboards
Track Team Velocity
Know exactly how fast your team ships
See your team's delivery speed in story points per business day. When reviews pile up or velocity drops, you'll know immediately. Weekly, monthly, and quarterly views help you spot patterns before they turn into real problems.
Smart 1-on-1 Preparation
Walk into every 1-on-1 fully prepared
Stop scrambling through dashboards five minutes before your meeting. One view shows you where each developer excels and where they need support, so you can have meaningful conversations instead of status updates.
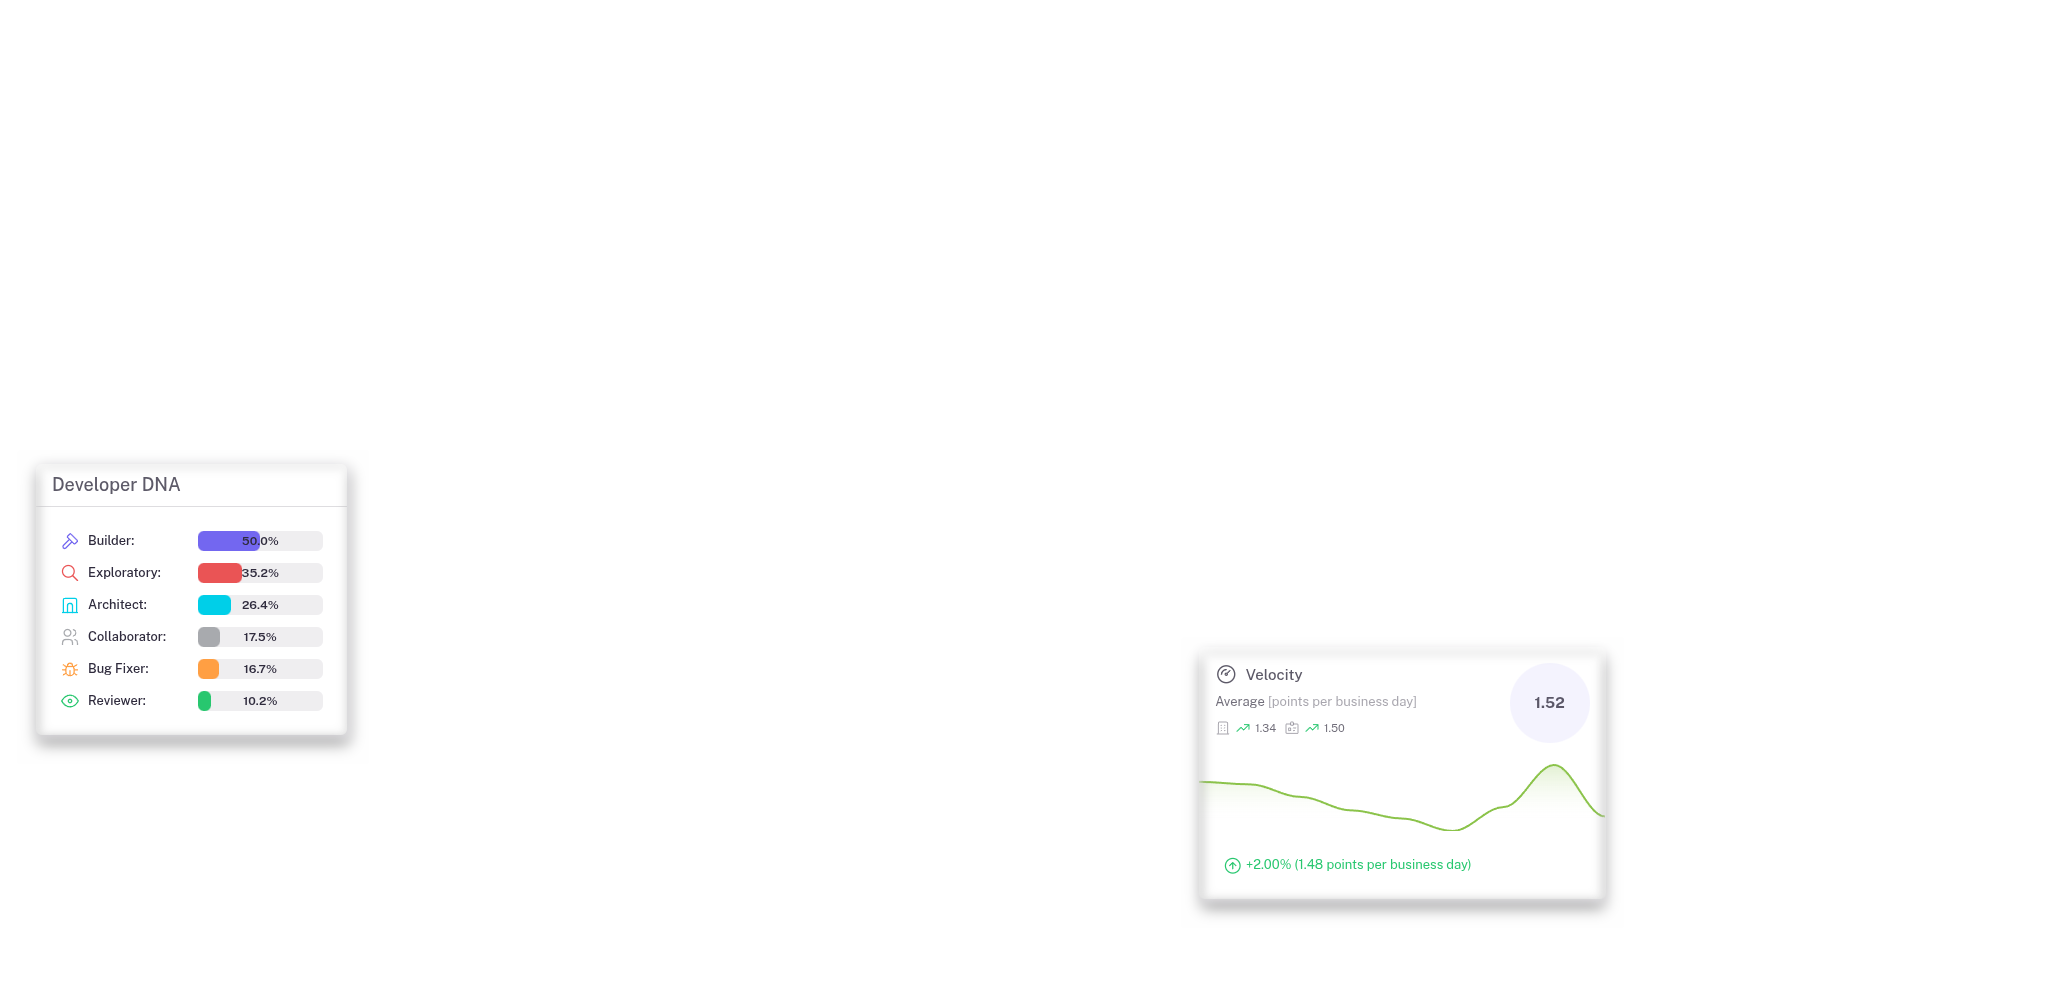
Know Your Team's DNA
Understand who does what, and how it changes over time
Every developer has a working style. Builder, Architect, Reviewer, Collaborator, Bug Fixer, or Exploratory. These archetypes shift naturally as work patterns change. See your team's composition and how it evolves with auto-generated insights.
Compare Anything
Put any two developers, teams, or time periods side by side
Want to know how the backend team compares to frontend this quarter? Or how a developer's output changed after switching teams? Pick any combination, choose your date ranges, and get interactive charts that tell the story.
Team Visualization
Your engineering org as a living, interactive map
Each developer is an animated entity on a canvas, grouped by team or epic. You can see at a glance who's working on what, which teams are overloaded, and where the bottlenecks are. Think of it as a bird's eye view of your entire engineering organization.
Ask, Don't Click
Get answers about your team in Claude Desktop
Just ask. "How's my team doing?" "Who's at risk of burnout?" "When will this epic be done?" You get real answers from your actual data, right inside Claude Desktop or Claude Code. No dashboards to open, no charts to interpret.
Projcity connects with your project management tools
The single source of truth that pulls context across your workflows and keeps everything in sync.
GitHub
Pull requests, commits, reviews
Shortcut
Stories, epics, iterations
Linear
Issues, cycles, projects
Projcity
Unified metrics & insights
50+ Engineering Metrics
Activity, velocity, cycle times & PR lifecycle
Dynamic Archetypes
6 archetypes that evolve with work patterns
Team Velocity
Sprint velocity & delivery predictability
AI-Powered Feedback
Personalized insights for every developer
Comprehensive engineering metrics platform with AI-powered insights
50+ Metrics
Track everything: Activity, Delivery, Quality, and Collaboration. Comprehensive metrics out of the box.
Automated Insights
Automated feedback, predictive scheduling, and performance summaries. No manual data analysis required.
6 Dynamic Archetypes
Automatically detect Builders, Architects, Reviewers, Collaborators, Bug Fixers, and Exploratory types. Archetypes shift as work patterns change.
Free for Small Teams
Get started free with 3 users. Pro plan at just $10/active user/month for unlimited access.
Team Health Tracking
Monitor workload patterns and team dynamics. Track velocity trends and identify areas for improvement.
Works With Your Tools
Easy setup, historical data import included. GitLab and Jira coming soon.
Engineering Leadership Questions, Answered
Real insights for modern engineering challenges
Free for Small Teams, Pro for Growth
Compare features side-by-side and choose the plan that fits your team.
Free
Pro
After 14 days, moves to Free automatically. No charges without your confirmation.
Pricing questions
Need more than 1 year of historical data? Contact us
Start Your Free Trial Today
Free for teams up to 3 users. Pro plan with full 50+ metrics starts at $10/user/month.
Ready to Get Started?
Create your account and connect your tools in minutes
Follow us for updates and tips
Frequently Askedquestions
Everything you need to know about Projcity
Built and used by the teams behind